Gant-chart in Excel?

Possible!
Many times, you need to be very creative to create advanced good-looking charts in Excel. As many of us know from experience, it is sometimes not that easy.
To help you in this, we here in Tieturi and Informator created a great new class for visualizing in Excel. The course is available both in Finnish and Swedish. In Finnish in Helsinki on 19 April and in Swedish in in Stockholm on 20 April and 26 May.
On the visualization course you learn, for example, how to create a Gant-chart with Excel.
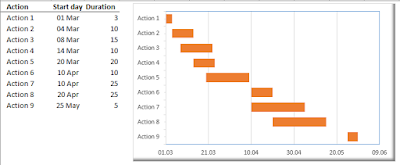
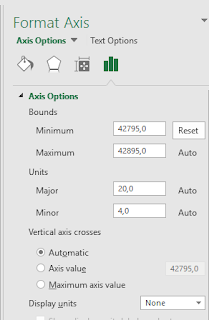
To create the above chart, I used a simple stacked bar chart and made one data series invisible (fill none, border no border). Then I formatted the x-axis as date. The challenge here is the date format. The x-axis uses date serial numbers, and I wanted to start my chart at a specific date. To get the correct serial number for the date, I typed the start day in an Excel cell with general number format. In this case, the serial number was 42795. I then copied the serial number to the Format Axis minimum box.
To get the action 1 on top, and the last action at bottom for the Y-axis I have put in reverse order. After doing that, I made the chart more readable by formatting different parts of the Chart, such as the x-axis date format and location in the chart etc.
Interested? Come and enjoy our class in either Helsinki or Stockholm and have fun with Excel >
Boris Isaksson